
可视化分布式监控系统 Prometheus + Grafana 快速搭建
有什么资源下不下来,直接call我,docker镜像还是外网资源
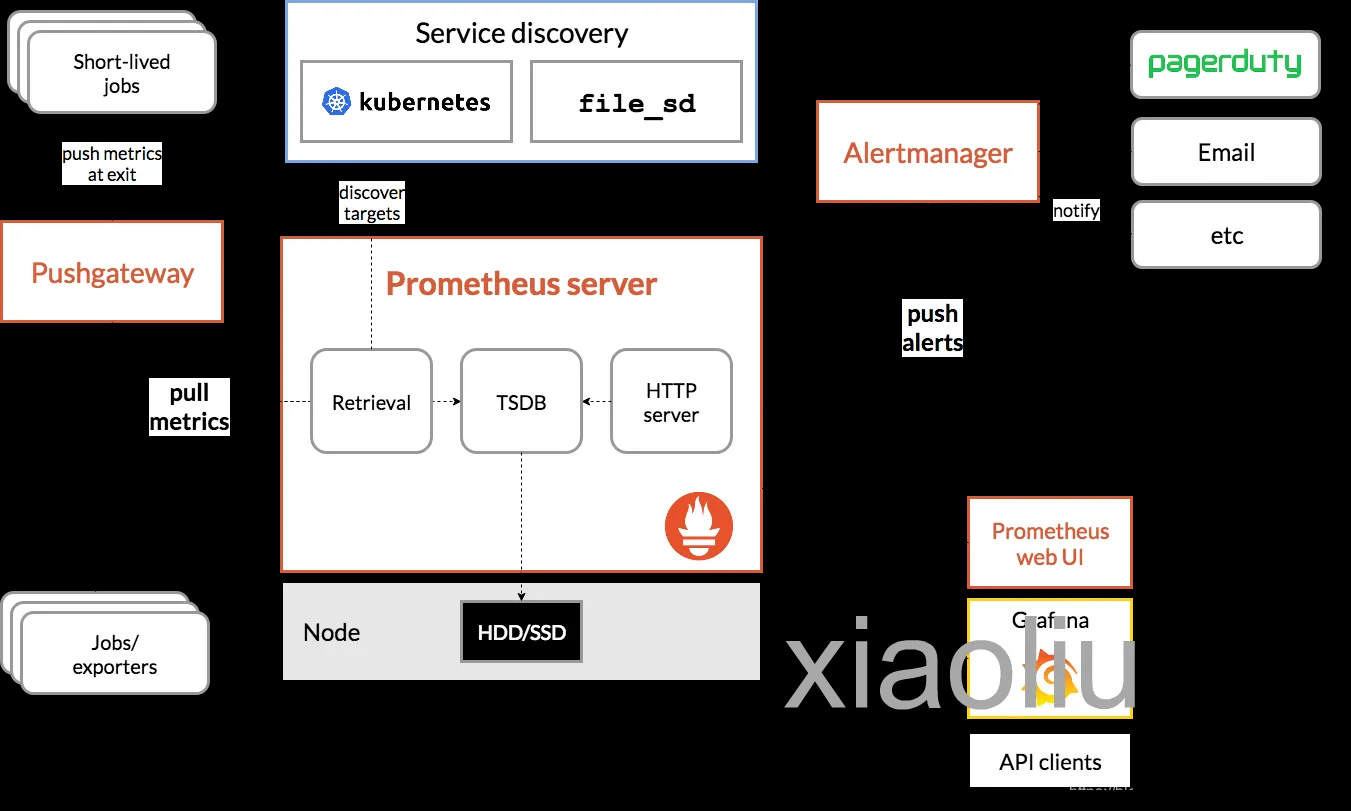
如上图,Prometheus 主要由以下部分组成:
- Prometheus:主要是负责存储、抓取、聚合、查询方面。
- Alertemanager:主要是负责实现报警功能。
- Pushgateway:主要是实现接收有 Client-push 过来的指标数据,在指定的时间间隔,有主程序来抓取。
- *_exporter:主要是负责采集物理机、中间件的信息。
Prometheus 安装
1.安装ntpdate工具,进行时间同步,关闭防火墙
yum -y install ntpdate
/usr/sbin/ntpdate ntp1.aliyun.com    #同步阿里云时间
yum install -y chrony
timedatectl set-timezone Asia/Shanghai
## 时间同步
sed -i 's/^pool pool.*/pool cn.pool.ntp.org iburst/g' /etc/chrony.conf && systemctl enable chronyd --now && chronyc sourcestats -v
2.下载 prometheus 并解压部署
https://prometheus.io/download/
最新地址
https://github.com/prometheus/prometheus/releases/tag/v2.53.0
最新安装包
wget https://github.com/prometheus/prometheus/releases/download/v3.0.0/prometheus-3.0.0.linux-amd64.tar.gz
# 创建目录
mkdir prometheus
# 下载安装包
wget https://github.com/prometheus/prometheus/releases/download/v3.0.0/prometheus-v3.0.0.linux-amd64.tar.gz
#解压安装包
tar -xf prometheus-v3.0.0.linux-amd64.tar.gz
# 移动改名-方便自启动
mv prometheus-2.47.2.linux-amd64 /usr/local/prometheus

#查看结果
ll /usr/local/prometheus
总用量 236840
drwxr-xr-x 2 mysql 127        38 10月 13 00:41 console_libraries
drwxr-xr-x 2 mysql 127       173 10月 13 00:41 consoles
-rw-r--r-- 1 mysql 127     11357 10月 13 00:41 LICENSE
-rw-r--r-- 1 mysql 127      3773 10月 13 00:41 NOTICE
-rwxr-xr-x 1 mysql 127 124149297 10月 13 00:11 prometheus
-rw-r--r-- 1 mysql 127       934 10月 13 00:41 prometheus.yml
-rwxr-xr-x 1 mysql 127 118350184 10月 13 00:14 promtool
3.创建 prometheus 用户并授权
## 创建用户
useradd -s /sbin/nologin prometheus
## 授权目录
chown -R prometheus:prometheus /usr/local/prometheus/
## 验证结果
ll /usr/local/prometheus/
总用量 236840
drwxr-xr-x 2 prometheus prometheus        38 10月 13 00:41 console_libraries
drwxr-xr-x 2 prometheus prometheus       173 10月 13 00:41 consoles
-rw-r--r-- 1 prometheus prometheus     11357 10月 13 00:41 LICENSE
-rw-r--r-- 1 prometheus prometheus      3773 10月 13 00:41 NOTICE
-rwxr-xr-x 1 prometheus prometheus 124149297 10月 13 00:11 prometheus
-rw-r--r-- 1 prometheus prometheus       934 10月 13 00:41 prometheus.yml
-rwxr-xr-x 1 prometheus prometheus 118350184 10月 13 00:14 promtool
4.配置 prometheus.service 文件,没有就创建
vim /usr/lib/systemd/system/prometheus.service

[Unit]
Description=prometheus
After=network.target

[Service]
User=prometheus
Group=prometheus
WorkingDirectory=/usr/local/prometheus
ExecStart=/usr/local/prometheus/prometheus \
          --config.file=/usr/local/prometheus/prometheus.yml \
          --web.listen-address=:9090 \
          --web.enable-lifecycle

[Install]
WantedBy=multi-user.target
curl -X POST http://localhost:9090/-/reload
只刷新配置文件,不重启
5.配置prometheus服务自启动
# 刷新
systemctl daemon-reload
# 自启动
systemctl enable --now prometheus
# 验证进程
ss -antulp |grep :9090
tcp    LISTEN     0  128  :::9090  :::*   users:(("prometheus",pid=6657,fd=7))
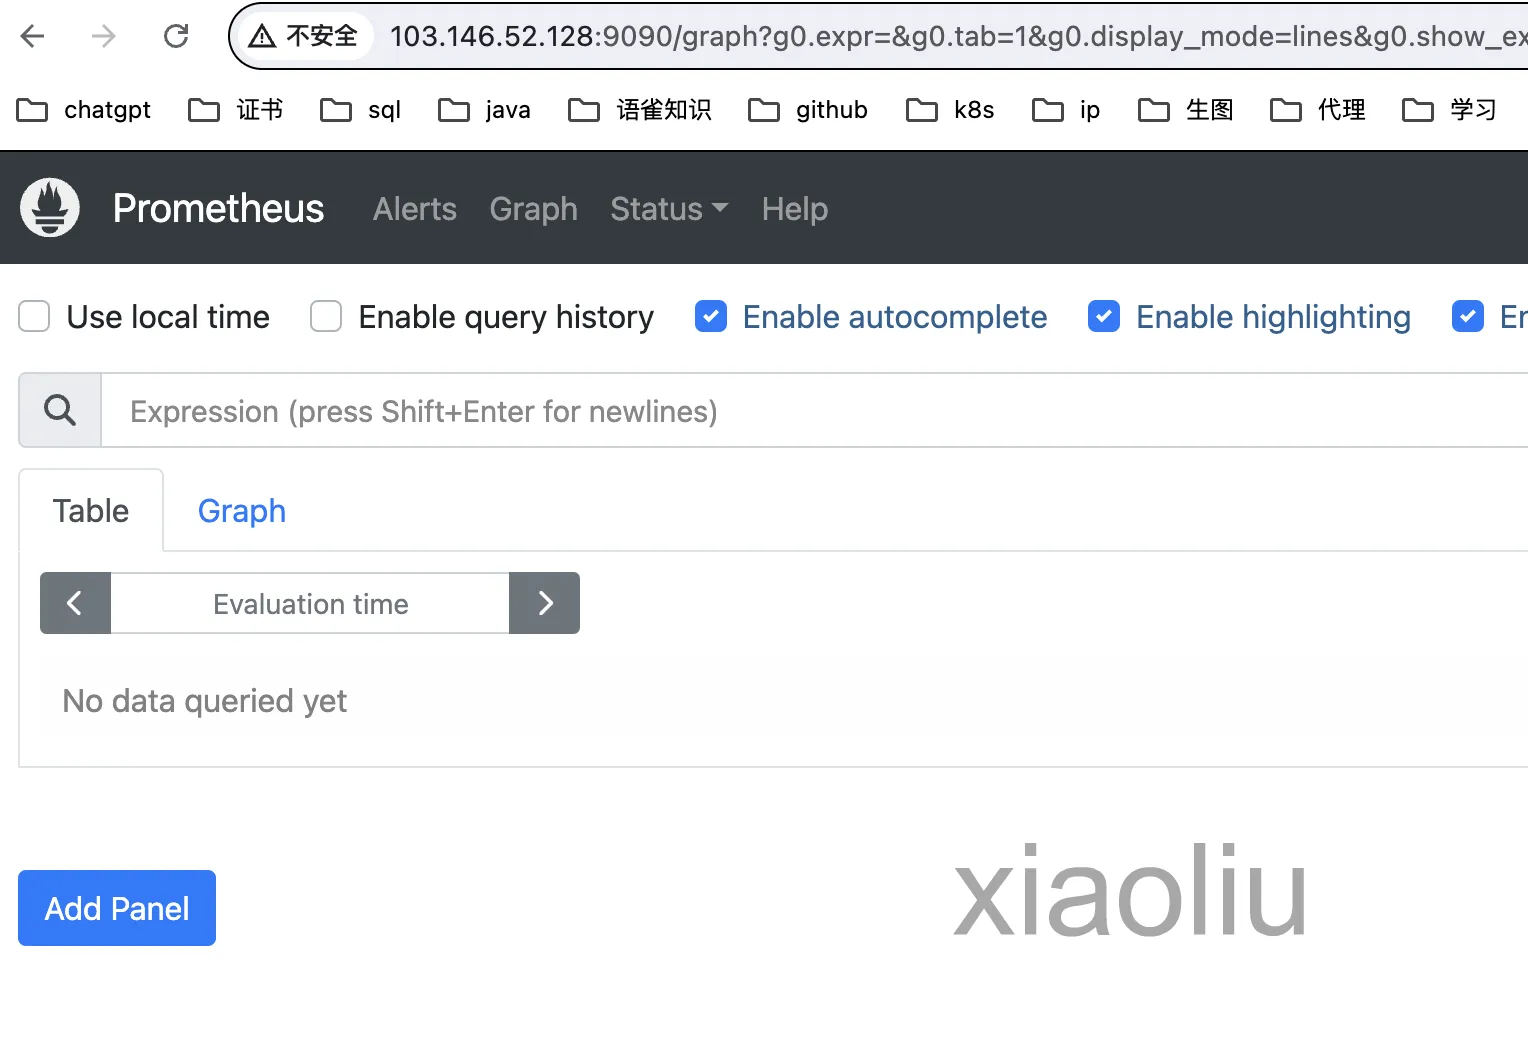
6.启动 Prometheus 服务后,通过 9090 端口来访问 Prometheus 自带的 UI 界面:
后端存储部署
:::tip{title="提示"}
默认情况下 Prometheus 会将采集的数据存储到本机的 /usr/local/prometheus/data 目录,存储数据的大小受限和扩展不便;所以这里使用 influxdb 作为后端的数据库来存储数据。
:::
https://github.com/influxdata/influxdb
https://github.com/influxdata/influxdb/releases
https://docs.influxdata.com/influxdb/v2/tools/influx-cli/?t=Linux
1.下载安装influxdb
## 下载rpm包
wget https://dl.influxdata.com/influxdb/releases/influxdb2-2.7.10-1.x86_64.rpm
# amd64
wget https://download.influxdata.com/influxdb/releases/influxdb2-client-2.7.5-linux-amd64.tar.gz
## 验证结果
ll
-rw-r--r-- 1 root root 51010897 10月 19 17:11 influxdb2-2.7.10-1.x86_64.rpm
-rw-r--r-- 1 root root 95708924 10月 19 17:11 prometheus-v3.0.0.linux-amd64.tar.gz
-rw-r--r-- 1 root root  11663685 Apr 16  2024 influxdb2-client-2.7.5-linux-amd64.tar.gz


## 自动搜寻依赖关系并安装
yum -y localinstall influxdb2-2.7.10-1.x86_64.rpm
# 生成配置文件
influxd print-config > /etc/influxdb/influxdb.conf
## 备份
cp /etc/influxdb/influxdb.conf /etc/influxdb/influxdb.conf.default
## 自启动
systemctl enable --now influxdb
## 启动cli
tar -xvzf influxdb2-client-2.7.5-linux-amd64.tar.gz -C /usr/local/bin/
yum安装
https://www.influxdata.com/downloads/
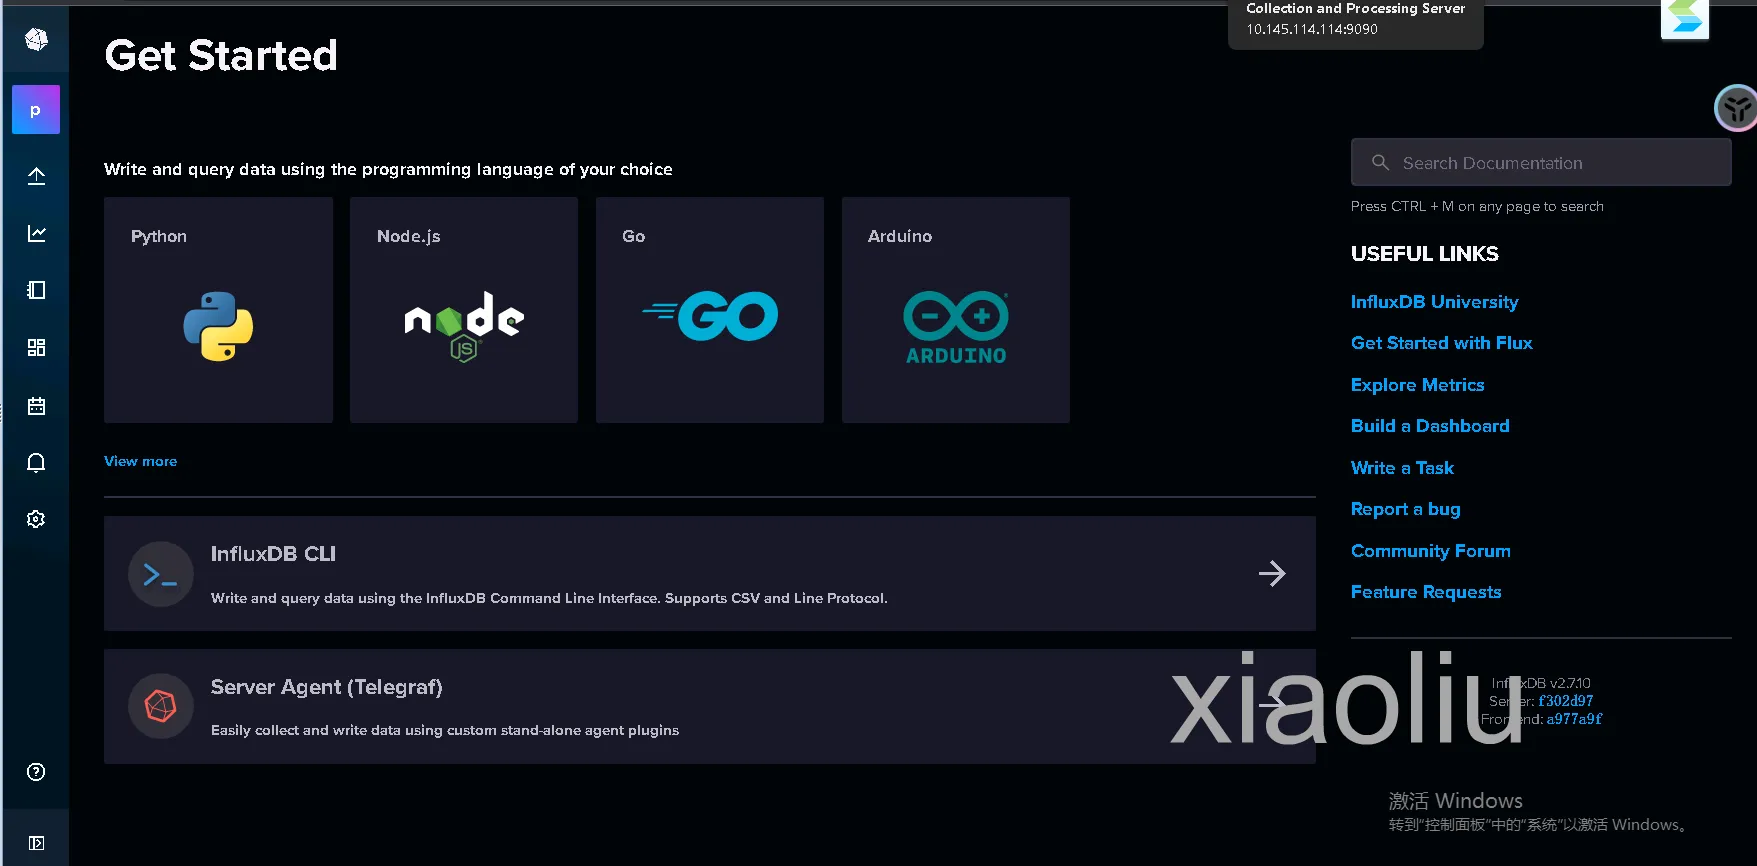
2.配置influxdb数据库,创建prometheus库,用于存储监控数据
查看版本:
influx version
初始化 InfluxDB(创建初始用户、组织和数据桶):

influx setup
写入数据到 InfluxDB:

influx write --bucket <桶名> --org <组织名> --file <文件路径>
执行 Flux 查询:

influx query '<flux 查询语句>'
检查 InfluxDB 健康状态:

influx ping
如果你需要与 InfluxDB 1.x 进行交互,可以使用 v1 子命令:

influx v1 shell

终端输入:influx version
Influx CLI dev (git: a79a2a1b825867421d320428538f76a4c90aa34c) build_date: 2024-04-16T14:34:32Z

## 先初始化

[root@iZi5c01jju8kitxftyr9taZ prometheus]# influx setup
> Welcome to InfluxDB 2.0!
? Please type your primary username prometheus
? Please type your password **********
? Please type your password again **********
? Please type your primary organization name prometheus
? Please type your primary bucket name prometheus
? Please type your retention period in hours, or 0 for infinite 7
? Setup with these parameters?
  Username:          prometheus
  Organization:      prometheus
  Bucket:            prometheus
  Retention Period:  7h0m0s
 Yes
User		Organization	Bucket
prometheus	prometheus	prometheus

## 更新
influx bucket update -i e1109c74fb60c997 --retention 72h

## 查看当前的数据库(桶)
[root@iZi5c01jju8kitxftyr9taZ prometheus]# influx bucket list
ID			Name		Retention	Shard group duration	Organization ID		Schema Type
4636bc5763ad2732	_monitoring	168h0m0s	24h0m0s			d86493636fa5e5d7	implicit
f90b38d70ac6623d	_tasks		72h0m0s		24h0m0s			d86493636fa5e5d7	implicit
e1109c74fb60c997	prometheus	7h0m0s		1h0m0s			d86493636fa5e5d7
3.配置 Prometheus 集成 infuxdb数据库
e1109c74fb60c997 是桶id
[root@iZi5c01jju8kitxftyr9taZ prometheus]# influx auth create \
> --org prometheus \
> --read-bucket e1109c74fb60c997 \
> --write-bucket e1109c74fb60c997
ID Description Token User Name User ID Permissions
0e044d92de16e000 v2PfxEIj-Kcgn4spcgLxNC6vDr73K4UVwJe0iSdiPUyF_GxuACGOzn_JuUpXDGZkn-HdgUjo9wcd1Sn6V3pdYQ== prometheus 0e0449882116e000 [read:orgs/d86493636fa5e5d7/buckets/e1109c74fb60c997 write:orgs/d86493636fa5e5d7/buckets/e1109c74fb60c997]
[root@iZi5c01jju8kitxftyr9taZ prometheus]#
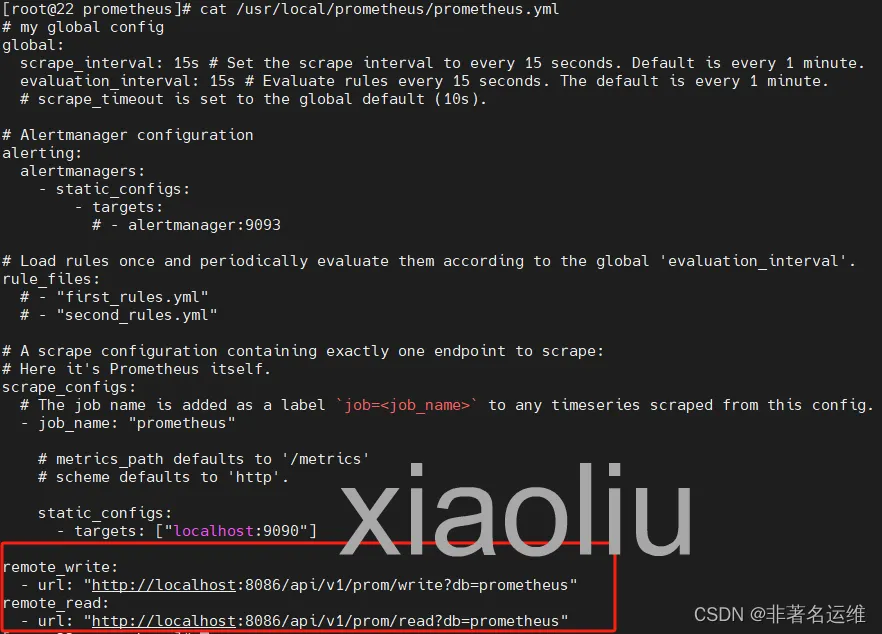
vim /usr/local/prometheus/prometheus.yml
remote_write:
- url: "http://localhost:8086/api/v1/prom/write?db=prometheus&u=prometheus&p=prometheus"
remote_read:
- url: "http://localhost:8086/api/v1/prom/read?db=prometheus&u=prometheus&p=prometheus"
:::danger{title="警告"}
注意:如果你的 influxdb 配置了密码,参考官方配置模板
influxdb官网:https://docs.influxdata.com/influxdb/v1/supported_protocols/prometheus/
remote_write:
  - url: "http://localhost:8086/api/v1/prom/write?db=prometheus&u=prometheus&p=prometheus"

remote_read:
  - url: "http://localhost:8086/api/v1/prom/read?db=prometheus&u=prometheus&p=prometheus"
使用 node-exporter 实现系统监控
因为 Prometheus 并不能直接监控服务,其主要任务负责数据的收集,存储并对外提供数据查询支持;因此,为了能够监控到某些东西,如:主机的 CPU 使用率,我们需要使用到 Exporter。
:::
1.下载安装 node-exporter-系统层面监控----cpu内存磁盘
官方地址
https://github.com/prometheus/node_exporter/releases
下载安装包
wget https://github.com/prometheus/node_exporter/releases/download/v1.8.2/node_exporter-1.8.2.linux-amd64.tar.gz
解压安装包
mkdir -p /usr/local/exporter
tar -xf node_exporter-1.8.2.linux-amd64.tar.gz -C /usr/local/exporter --strip-components=1


##验证结果
ll /usr/local/exporter
总用量 16500
-rw-r--r-- 1 3434 3434    11357 6月   5 2019 LICENSE
-rwxr-xr-x 1 3434 3434 16878582 6月   5 2019 node_exporter
-rw-r--r-- 1 3434 3434      463 6月   5 2019 NOTICE
2.创建 node_exporter 服务自启动管理文件
## 创建自启动文件
vim /usr/lib/systemd/system/node_exporter.service
## 文件内容
[Unit]
Description=node_exporter
After=network.target

[Service]
ExecStart=/usr/local/exporter/node_exporter \
          --web.listen-address=:20001 \
          --collector.systemd \
          --collector.systemd.unit-whitelist=(sshd|nginx).service \
          --collector.processes
[Install]
WantedBy=multi-user.target

## 刷新
systemctl daemon-reload
## 自启动
systemctl enable --now node_exporter

## 验证结果
systemctl status node_exporter

ss -antulp |grep :20001
tcp    LISTEN     0      128      :::20001                :::*                   users:(("node_exporter",pid=15672,fd=3))

ps -aux | grep -v grep | grep node_exporter
prometh+  15672  0.0  0.4 113420  4976 ?        Ssl  10月19   0:00 /usr/local/exporter/node_exporter --web.listen-address=:20001 --collector.systemd --collector.systemd.unit-whitelist=(sshd|nginx).service --collector.processes
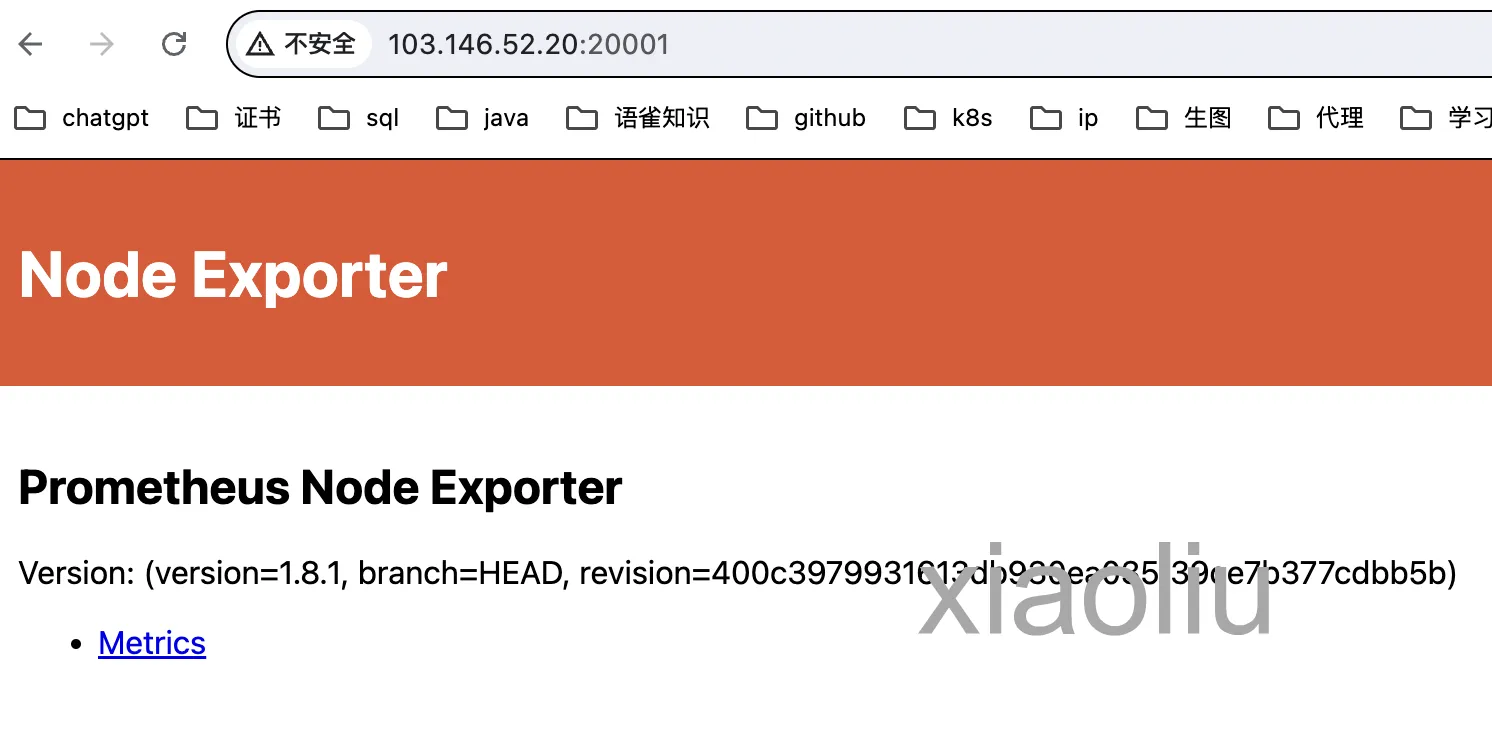
3.启动 node_exporter 服务后,通过 20001 端口来访问 Client 的监控指标。
4.修改 Promehteus 配置文件,添加主机配置
打开主配置文件
vim /usr/local/prometheus/prometheus.yml

添加
static_configs:           #相关配置
      - targets: ["localhost:9090"]
  - job_name: "Client"
    static_configs:
      - targets:
        - "192.168.101.22:20001"  ##改为你的ip
添加成功后的文件为
scrape_configs:
  # The job name is added as a label `job=<job_name>` to any timeseries scraped from this config.
  - job_name: "prometheus"

    # metrics_path defaults to '/metrics'
    # scheme defaults to 'http'.

    static_configs:           #相关配置
      - targets: ["localhost:9090"]
  - job_name: "Client"
    static_configs:
      - targets:
        - "192.168.101.22:20001"

remote_write:
  - url: "http://localhost:8086/api/v1/prom/write?db=prometheus"
remote_read:
  - url: "http://localhost:8086/api/v1/prom/read?db=prometheus"

## 重启prometheus
systemctl restart prometheus
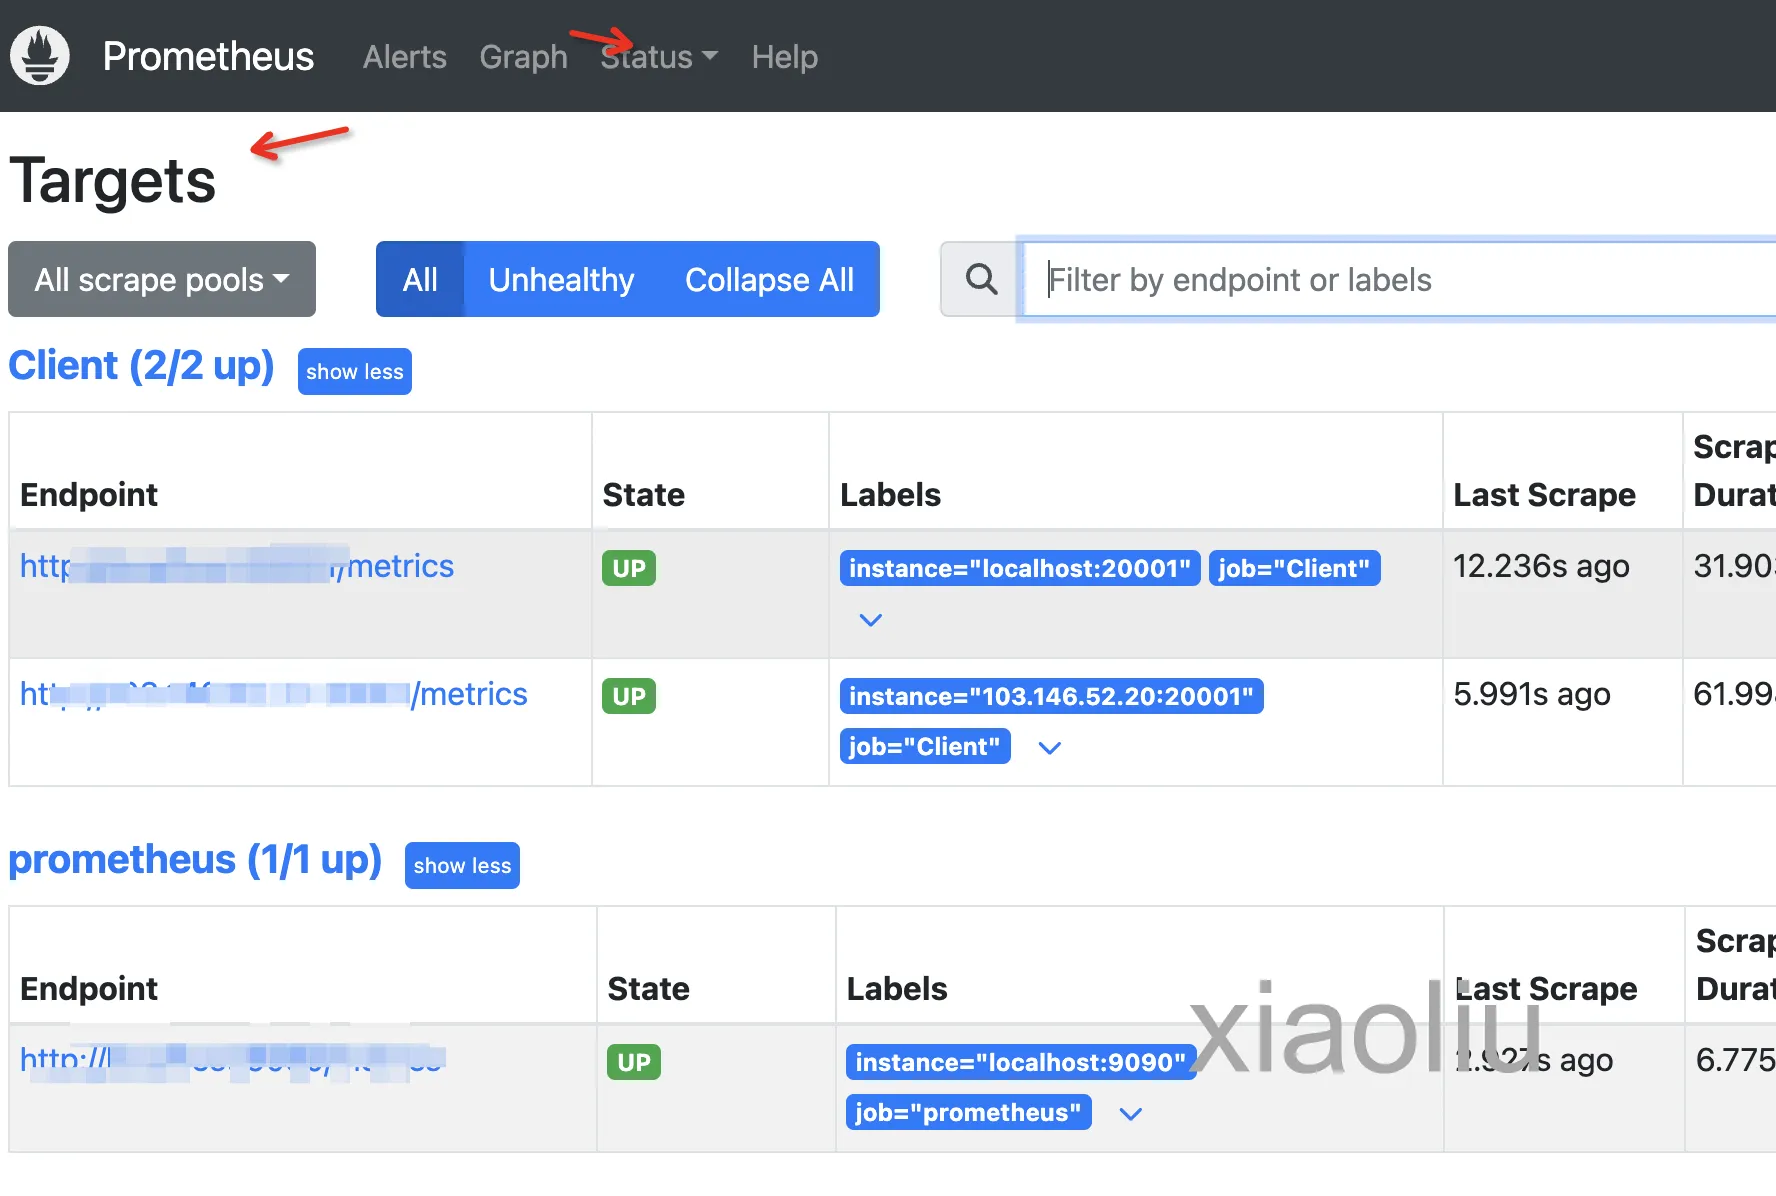
5.访问 prometheus,查看 client 主机的监控数据
使用 Prometheus + Grafana 实现可视化界面
:::info{title="相关信息"}
在 Prometheus 中,我们可以使用 Web 界面进行数据的查询和展示,但是展示效果不是很好;
所以我们这里使用 Grafana 来配合 Prometheus 使用。
:::
1.下载安装grafana
可视化
https://grafana.com/grafana/download
## 下载rpm包
https://grafana.com/grafana/download
yum install -y https://dl.grafana.com/enterprise/release/grafana-enterprise-11.3.1-1.x86_64.rpm
## 自启动
systemctl enable --now grafana-server
## 查看端口是否运行
ss -antulp |grep :3000
tcp    LISTEN     0      128      :::3000                 :::*                   users:(("grafana-server",pid=20775,fd=6))

[root@22 prometheus]# ps -aux |grep -v grep |grep grafana
grafana   20775  0.7  2.6 533052 26064 ?        Ssl  01:10   0:00 /usr/sbin/grafana-server --config=/etc/grafana/grafana.ini --pidfile=/var/run/grafana/grafana-server.pid --packaging=rpm cfg:default.paths.logs=/var/log/grafana cfg:default.paths.data=/var/lib/grafana cfg:default.paths.plugins=/var/lib/grafana/plugins cfg:default.paths.provisioning=/etc/grafana/provisioning
2.配置 Grafana 的 Web 界面
默认的初始账号密码都是admin

第一次登录会提示更改密码,自己设置下
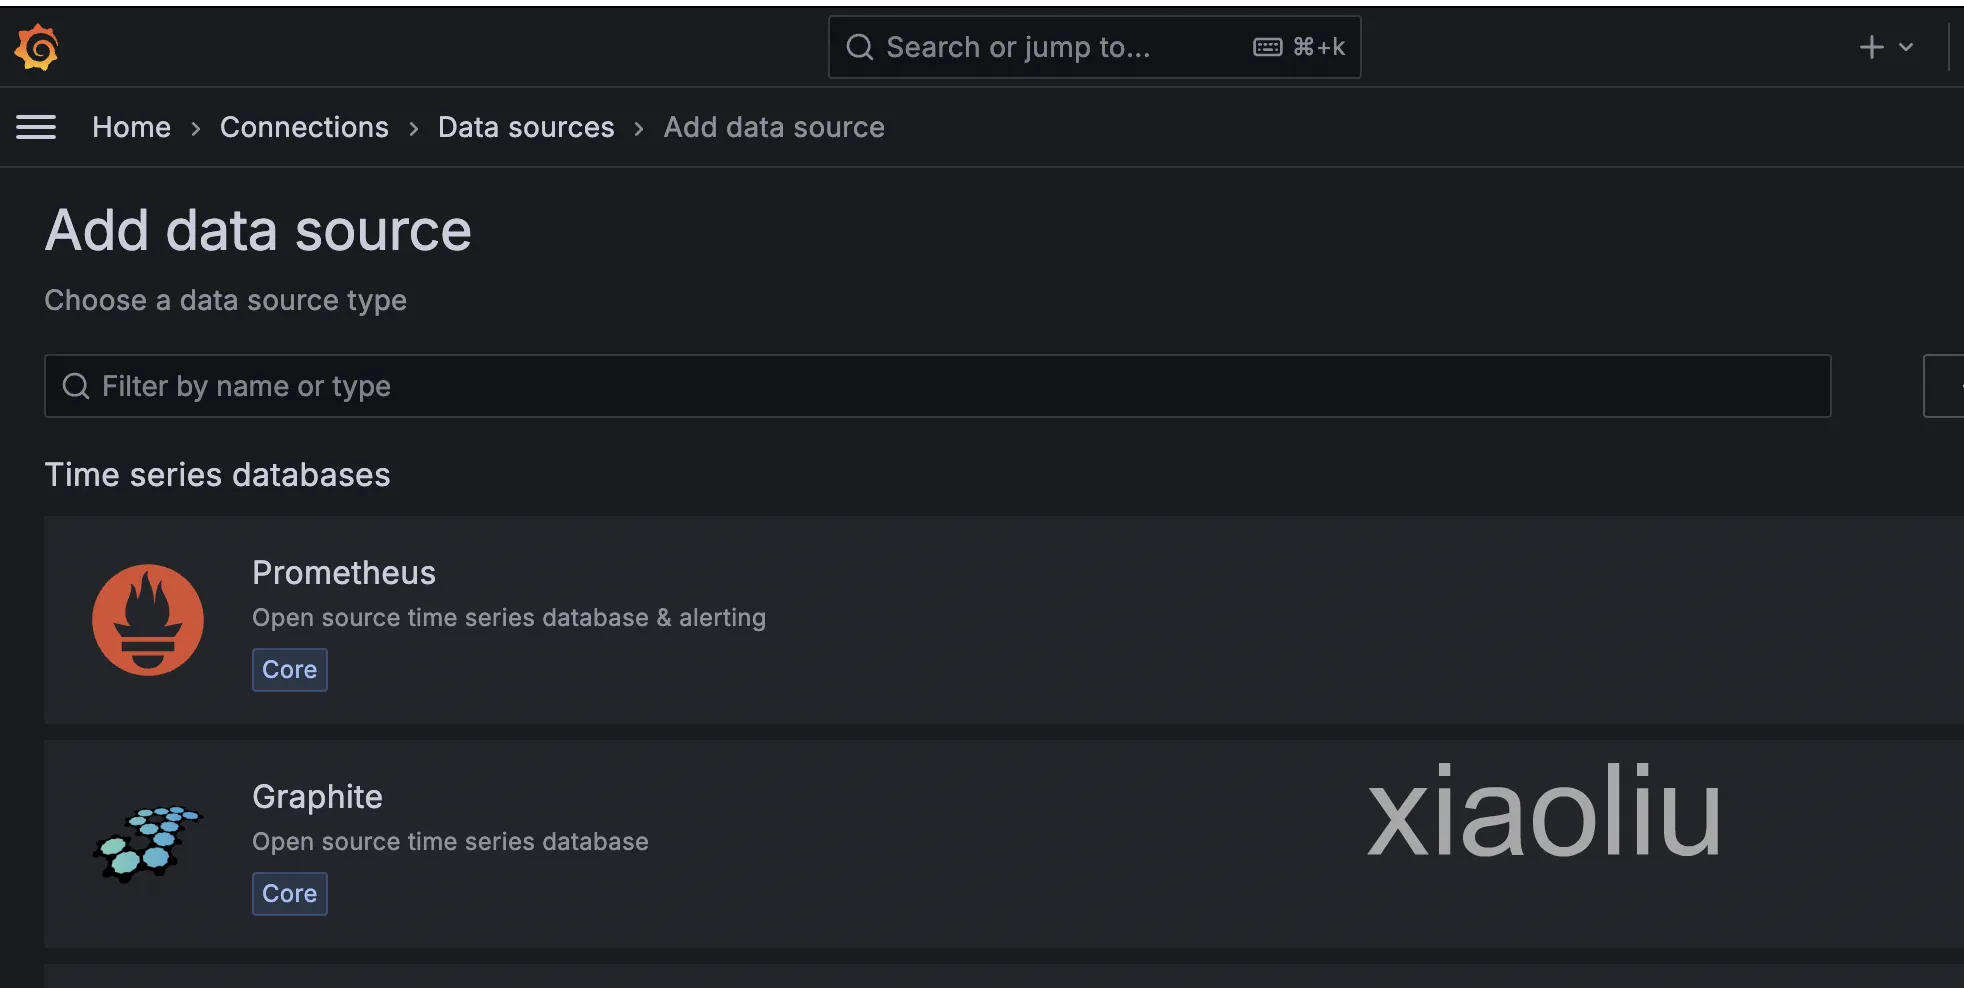
3.提示Add data source(添加数据源)
http://你的ip:3000/connections/datasources
点击prometheus
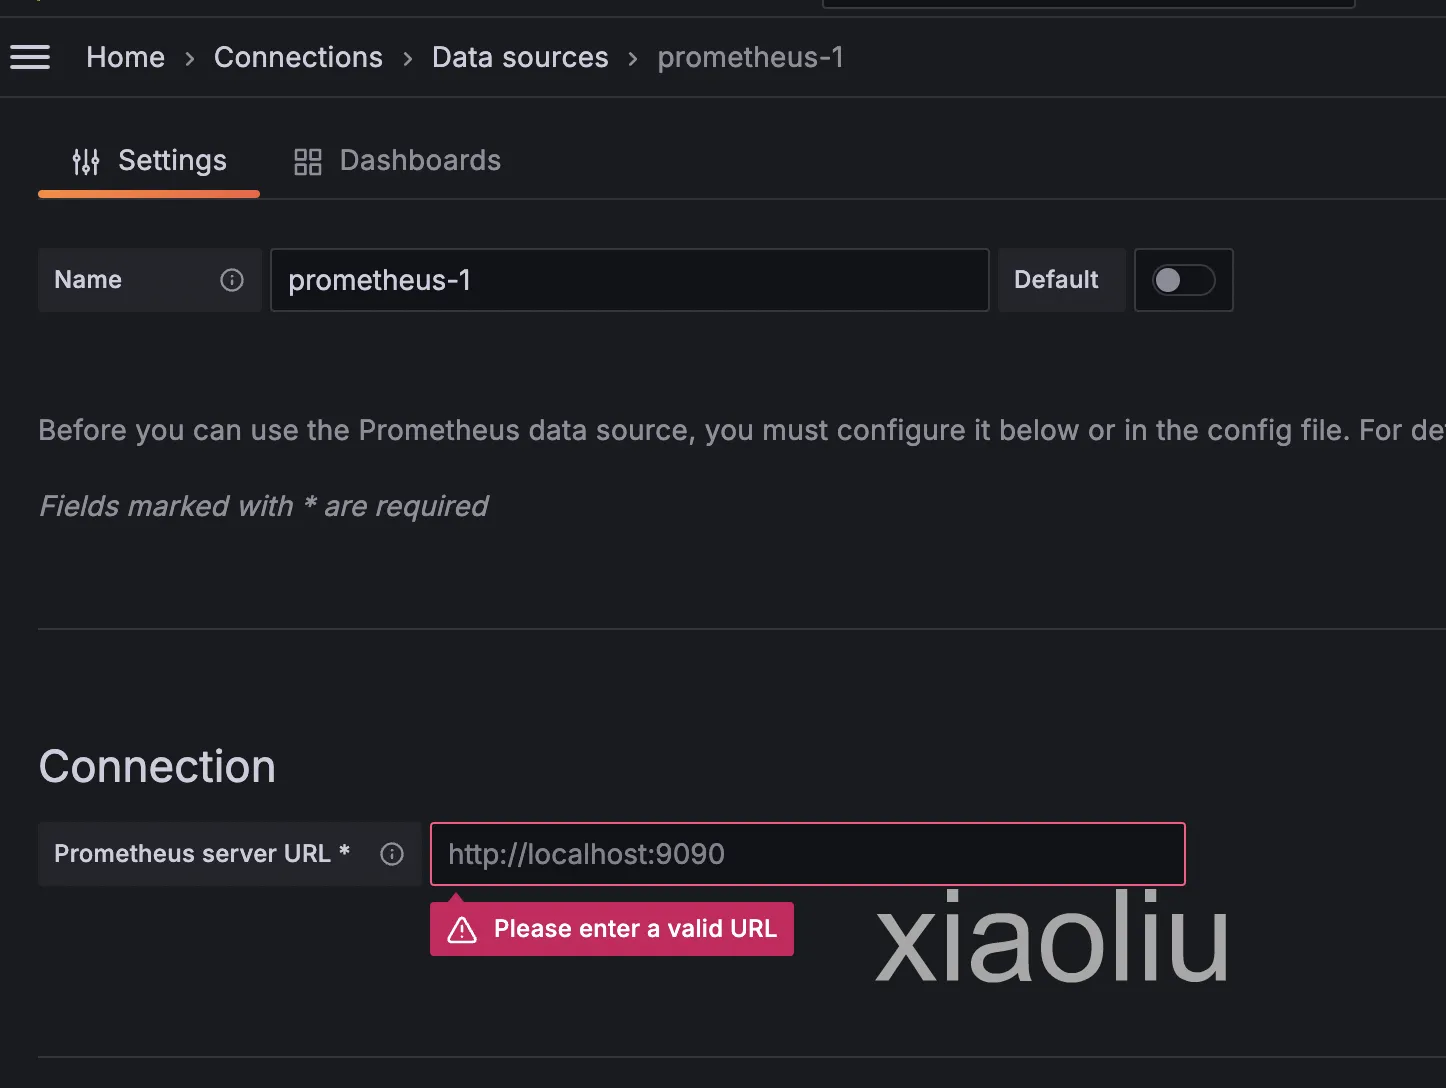
填写你的prometheus的访问url然后点击最下面的save
http://你的ip:3000/dashboard/import
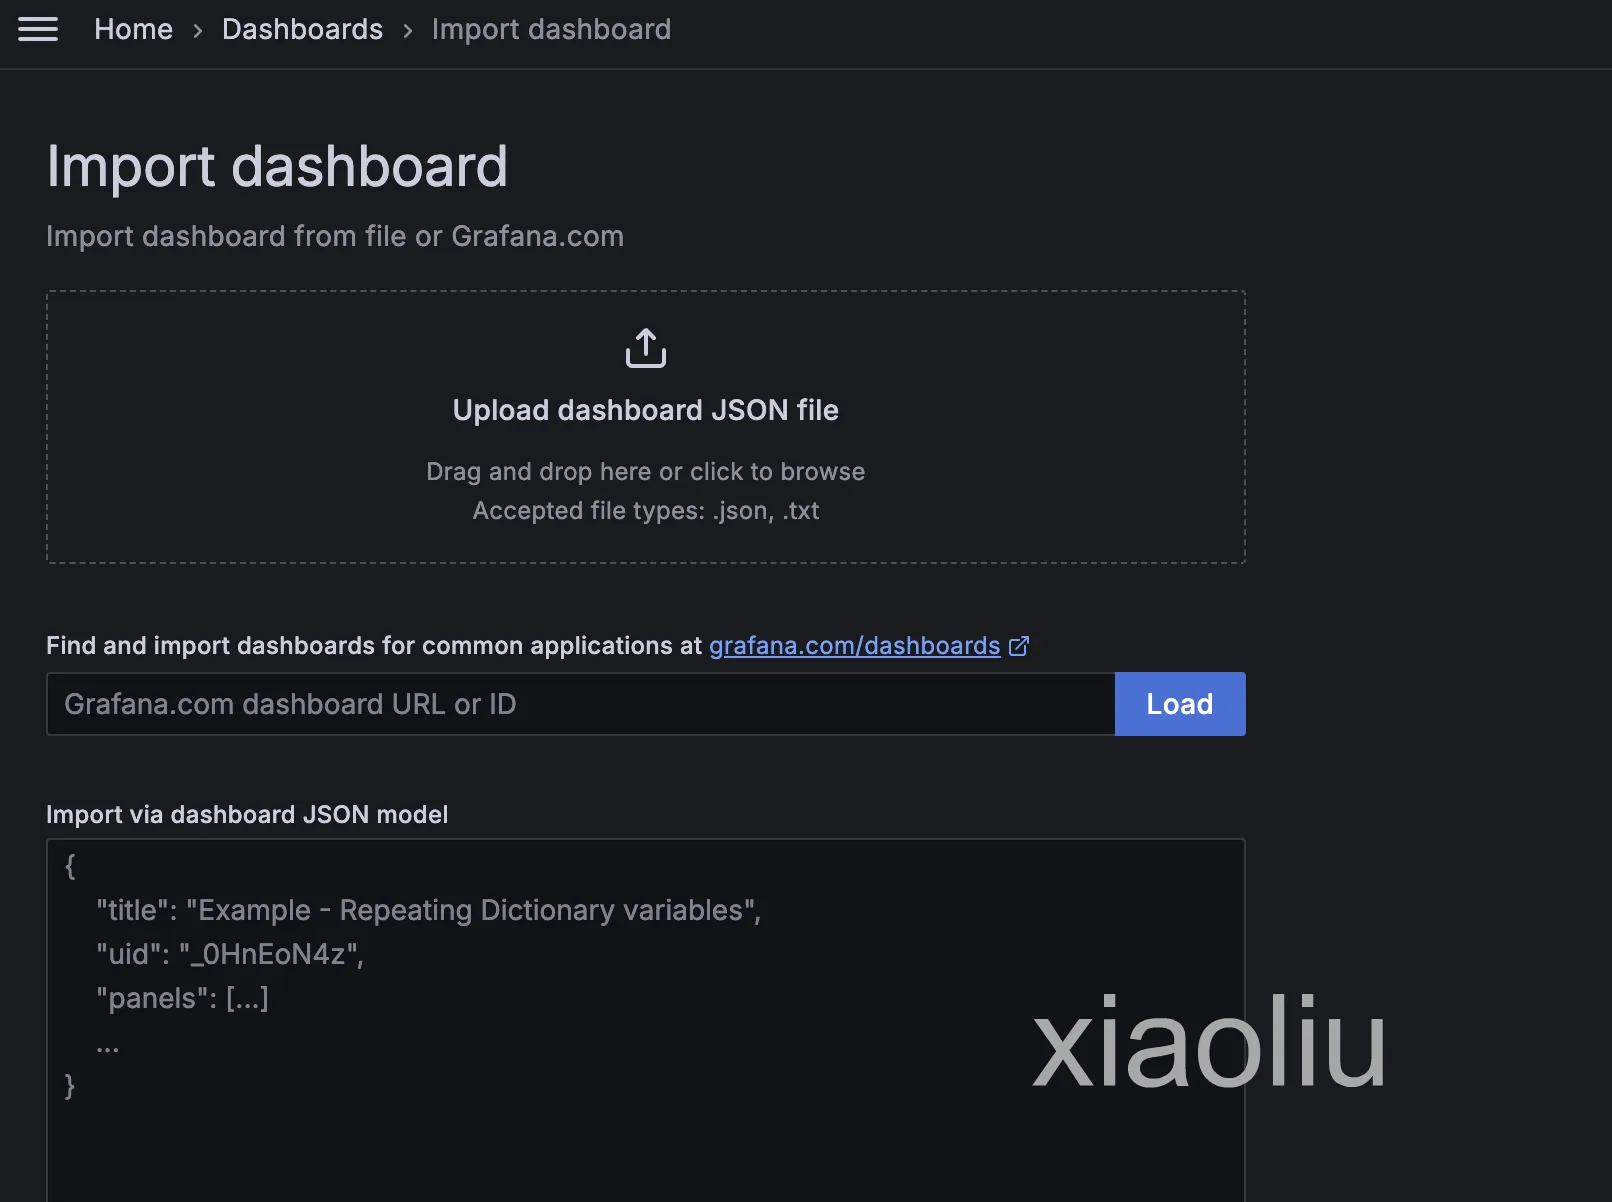
填入id,id去官方模版找,当前用的是

官方模版
https://grafana.com/grafana/dashboards/
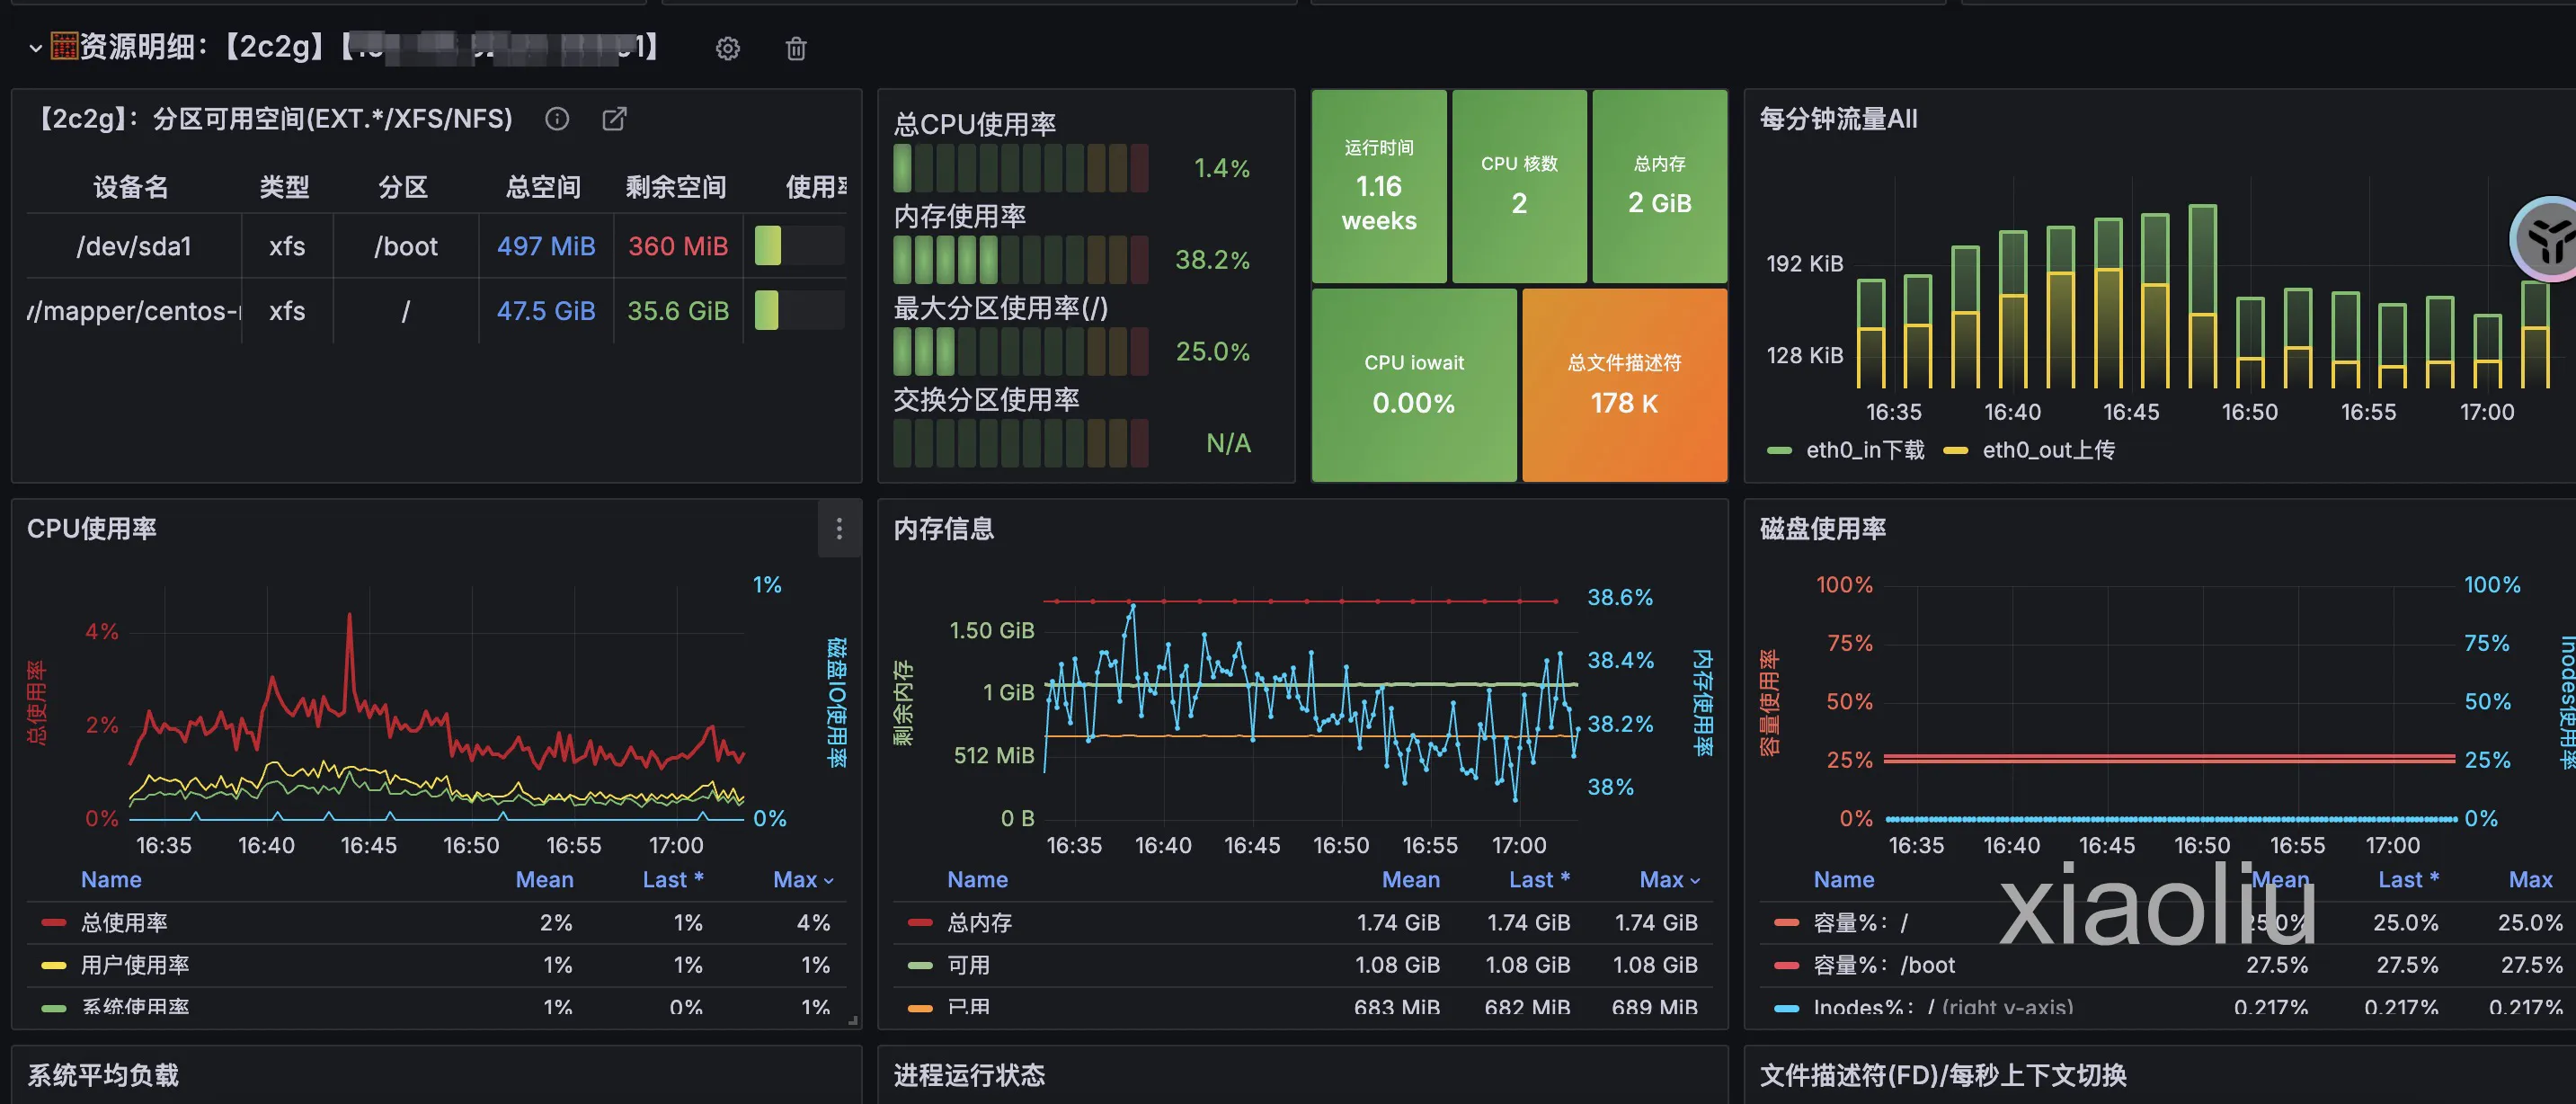
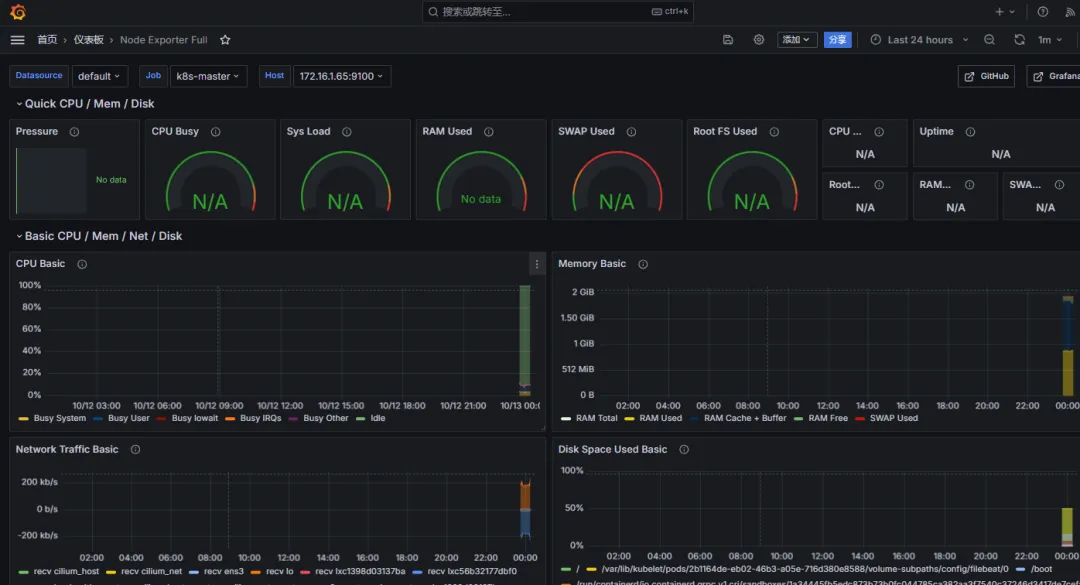
效果
搭建集群逻辑
只需要在另一个机器上运行一个node程序,前面有教程
然后在prometheus。yml中,添加ip端口就可以了
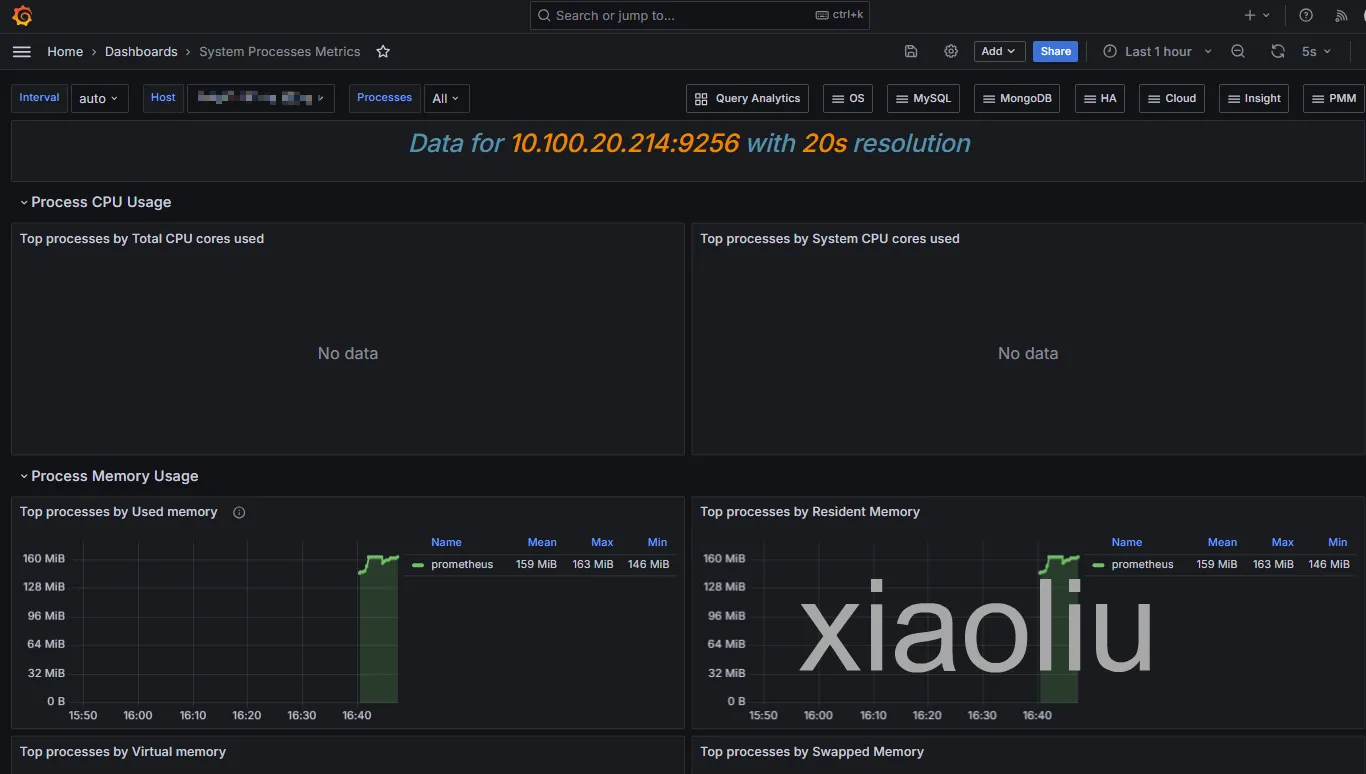
process-exporter:专注于特定进程,可以配置监控哪些进程,提供更详细的指标(如 CPU、内存使用等),适合需要针对特定应用进行深入分析的场景。
wget https://github.com/ncabatoff/process-exporter/releases/download/v0.8.3/process-exporter-0.8.3.linux-amd64.tar.gz
tar -xf process-exporter-0.8.3.linux-amd64.tar.gz
mv process-exporter-0.8.3.linux-amd64 /usr/local/process


vim /usr/local/process/config.yml
process_names:
  - name: "prometheus"
    cmdline:
      - "prometheus"


cat /etc/systemd/system/process-exporter.service
[Unit]
Description=Process Exporter
After=network.target

[Service]
User=root
Group=root
ExecStart=/usr/local/process/process-exporter \
          --web.listen-address=:9256 \
          --config.path=/usr/local/process/config.yml

[Install]
WantedBy=multi-user.target
需要自己一个一个加
Top 命令:显示系统上所有进程的实时快照,主要用于快速查看所有进程的资源使用情况,适合于实时监控和排查系统问题,但不如 process-exporter 详细。
Mimic "top" 的功能
参考
https://www.cnblogs.com/yangmeichong/p/18156586
Prometheus告警通知配置、Alertmanager
1.下载安装 Alertmanager-通知
官方地址
https://github.com/prometheus/alertmanager/releases
参考地址
https://www.cnblogs.com/hong-fithing/p/14868049.html
模板地址
https://github.com/feiyu563/PrometheusAlert/issues/30
官方优化脚本
https://feiyu563.gitbook.io/prometheusalert/conf/conf-dingding
## 下载安装包
wget https://github.com/prometheus/alertmanager/releases/download/v0.27.0/alertmanager-0.27.0.linux-amd64.tar.gz

## 解压安装包
mkdir -p /usr/local/alertmanager
tar -xf alertmanager-0.27.0.linux-amd64.tar.gz -C /usr/local/alertmanager --strip-components=1


##验证结果
ll /usr/local/alertmanager
total 65916
-rwxr-xr-x 1 1001 1002 37345962 Feb 28  2024 alertmanager
-rw-r--r-- 1 1001 1002      356 Feb 28  2024 alertmanager.yml
-rwxr-xr-x 1 1001 1002 30130103 Feb 28  2024 amtool
-rw-r--r-- 1 1001 1002    11357 Feb 28  2024 LICENSE
-rw-r--r-- 1 1001 1002      457 Feb 28  2024 NOTICE
2.创建 alertmanager 服务自启动管理文件
## 创建自启动文件
vim /usr/lib/systemd/system/alertmanager.service

## 文件内容
[Unit]
Description=Alertmanager
Documentation=https://prometheus.io/docs/alerting/latest/alertmanager/
After=network.target

[Service]
User=alertmanager
Group=alertmanager
ExecStart=/usr/local/alertmanager/alertmanager --config.file=/usr/local/alertmanager/alertmanager.yml
Restart=on-failure
LimitNOFILE=4096
EnvironmentFile=-/etc/sysconfig/alertmanager

[Install]
WantedBy=multi-user.target


## 刷新
systemctl daemon-reload
## 自启动
systemctl enable --now alertmanager

## 验证结果
systemctl status alertmanager

[root@iZi5c01zlzty2isavfgor5Z opt]# ss -antulp |grep :9093
tcp    LISTEN     0      128    [::]:9093               [::]:*                   users:(("alertmanager",pid=36283,fd=8))
[root@iZi5c01zlzty2isavfgor5Z opt]# ps -aux | grep -v grep | grep alertmanager
root      35511  0.0  0.0 152172  4736 pts/0    T    15:52   0:00 wget https://github.com/prometheus/alertmanager/releases/download/v0.27.0/alertmanager-0.27.0.linux-amd64.tar.gz
root      36283  0.3  0.3 1255892 25524 ?       Ssl  16:06   0:00 /usr/local/alertmanager/alertmanager --config.file=/usr/local/alertmanager/alertmanager.yml
[root@iZi5c01zlzty2isavfgor5Z opt]#
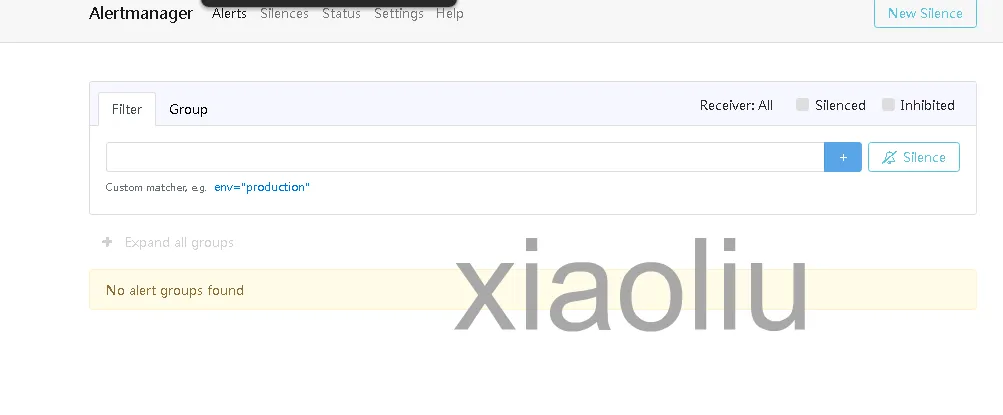
ip:9093
官方文档模板
https://prometheus.io/docs/prometheus/latest/configuration/configuration/
prometheus-alert 多通知方式
vim /opt/linux/conf/app.conf
[root@iZi5c01zlzty2isavfgor5Z alertmanager]# cat /opt/linux/conf/app.conf
#---------------------↓全局配置-----------------------
appname = PrometheusAlert
#登录用户名
login_user=prometheusalert
#登录密码
login_password=prometheusalert
#监听地址
httpaddr = "0.0.0.0"
#监听端口
httpport = 8080
runmode = dev
#设置代理 proxy = http://123.123.123.123:8080
proxy =
#开启JSON请求
copyrequestbody = true
#告警消息标题
title=PrometheusAlert
#链接到告警平台地址
GraylogAlerturl=http://graylog.org
#钉钉告警 告警logo图标地址
logourl=https://img.soutula.com/bmiddle/006APoFYly1g0n412ysd5j306o06o0tm.jpg
#钉钉告警 恢复logo图标地址
rlogourl=https://img.soutula.com/large/006BkP2Hly1g0kux0p6lqg30f00f0b2e.gif
#短信告警级别(等于3就进行短信告警) 告警级别定义 0 信息,1 警告,2 一般严重,3 严重,4 灾难
messagelevel=3
#电话告警级别(等于4就进行语音告警) 告警级别定义 0 信息,1 警告,2 一般严重,3 严重,4 灾难
phonecalllevel=4
#默认拨打号码(页面测试短信和电话功能需要配置此项)
defaultphone=xxxxxxxx
#故障恢复是否启用电话通知0为关闭,1为开启
phonecallresolved=0
#自动告警抑制(自动告警抑制是默认同一个告警源的告警信息只发送告警级别最高的第一条告警信息,其他消息默认屏蔽,这么做的目的是为了减少相同告警来源的消息数量,防止告警炸弹,0为关闭,1为开启)
silent=0
#是否前台输出file or console
logtype=file
#日志文件路径
logpath=logs/prometheusalertcenter.log
#转换Prometheus,graylog告警消息的时区为CST时区(如默认已经是CST时区,请勿开启)
prometheus_cst_time=0
#数据库驱动,支持sqlite3,mysql,postgres如使用mysql或postgres,请开启db_host,db_port,db_user,db_password,db_name的注释
db_driver=sqlite3
#db_host=127.0.0.1
#db_port=3306
#db_user=root
#db_password=root
#db_name=prometheusalert
#是否开启告警记录 0为关闭,1为开启
AlertRecord=0
# 是否将告警记录写入es7,0为关闭,1为开启
alert_to_es=0
# es地址,是[]string
# beego.Appconfig.Strings读取配置为[]string,使用";"而不是","
to_es_url=http://localhost:9200
# to_es_url=http://es1:9200;http://es2:9200;http://es3:9200
# es用户和密码
# to_es_user=username
# to_es_pwd=password

#---------------------↓webhook-----------------------
#是否开启钉钉告警通道,可同时开始多个通道0为关闭,1为开启
open-dingding=1
#默认钉钉机器人地址
ddurl=https://oapi.dingtalk.com/robot/send?access_token=c04672a861211fd2653c579a2fb62e02ed2503c0d4370a233d5ab0acb0c5f9d3
#是否开启 @所有人(0为关闭,1为开启)
dd_isatall=1

#是否开启微信告警通道,可同时开始多个通道0为关闭,1为开启
open-weixin=1
#默认企业微信机器人地址
wxurl=https://qyapi.weixin.qq.com/cgi-bin/webhook/send?key=xxxxx

#是否开启飞书告警通道,可同时开始多个通道0为关闭,1为开启
open-feishu=0
#默认飞书机器人地址
fsurl=https://open.feishu.cn/open-apis/bot/hook/xxxxxxxxx

#---------------------↓腾讯云接口-----------------------
#是否开启腾讯云短信告警通道,可同时开始多个通道0为关闭,1为开启
open-txdx=0
#腾讯云短信接口key
TXY_DX_appkey=xxxxx
#腾讯云短信模版ID 腾讯云短信模版配置可参考 prometheus告警:{1}
TXY_DX_tpl_id=xxxxx
#腾讯云短信sdk app id
TXY_DX_sdkappid=xxxxx
#腾讯云短信签名 根据自己审核通过的签名来填写
TXY_DX_sign=腾讯云

#是否开启腾讯云电话告警通道,可同时开始多个通道0为关闭,1为开启
open-txdh=0
#腾讯云电话接口key
TXY_DH_phonecallappkey=xxxxx
#腾讯云电话模版ID
TXY_DH_phonecalltpl_id=xxxxx
#腾讯云电话sdk app id
TXY_DH_phonecallsdkappid=xxxxx

#---------------------↓华为云接口-----------------------
#是否开启华为云短信告警通道,可同时开始多个通道0为关闭,1为开启
open-hwdx=0
#华为云短信接口key
HWY_DX_APP_Key=xxxxxxxxxxxxxxxxxxxxxx
#华为云短信接口Secret
HWY_DX_APP_Secret=xxxxxxxxxxxxxxxxxxxxxx
#华为云APP接入地址(端口接口地址)
HWY_DX_APP_Url=https://rtcsms.cn-north-1.myhuaweicloud.com:10743
#华为云短信模板ID
HWY_DX_Templateid=xxxxxxxxxxxxxxxxxxxxxx
#华为云签名名称,必须是已审核通过的,与模板类型一致的签名名称,按照自己的实际签名填写
HWY_DX_Signature=华为云
#华为云签名通道号
HWY_DX_Sender=xxxxxxxxxx

#---------------------↓阿里云接口-----------------------
#是否开启阿里云短信告警通道,可同时开始多个通道0为关闭,1为开启
open-alydx=0
#阿里云短信主账号AccessKey的ID
ALY_DX_AccessKeyId=xxxxxxxxxxxxxxxxxxxxxx
#阿里云短信接口密钥
ALY_DX_AccessSecret=xxxxxxxxxxxxxxxxxxxxxx
#阿里云短信签名名称
ALY_DX_SignName=阿里云
#阿里云短信模板ID
ALY_DX_Template=xxxxxxxxxxxxxxxxxxxxxx

#是否开启阿里云电话告警通道,可同时开始多个通道0为关闭,1为开启
open-alydh=0
#阿里云电话主账号AccessKey的ID
ALY_DH_AccessKeyId=xxxxxxxxxxxxxxxxxxxxxx
#阿里云电话接口密钥
ALY_DH_AccessSecret=xxxxxxxxxxxxxxxxxxxxxx
#阿里云电话被叫显号,必须是已购买的号码
ALY_DX_CalledShowNumber=xxxxxxxxx
#阿里云电话文本转语音(TTS)模板ID
ALY_DH_TtsCode=xxxxxxxx

#---------------------↓容联云接口-----------------------
#是否开启容联云电话告警通道,可同时开始多个通道0为关闭,1为开启
RLY_DH_open-rlydh=0
#容联云基础接口地址
RLY_URL=https://app.cloopen.com:8883/2013-12-26/Accounts/
#容联云后台SID
RLY_ACCOUNT_SID=xxxxxxxxxxx
#容联云api-token
RLY_ACCOUNT_TOKEN=xxxxxxxxxx
#容联云app_id
RLY_APP_ID=xxxxxxxxxxxxx

#---------------------↓邮件配置-----------------------
#是否开启邮件
open-email=0
#邮件发件服务器地址
Email_host=smtp.qq.com
#邮件发件服务器端口
Email_port=465
#邮件帐号
Email_user=xxxxxxx@qq.com
#邮件密码
Email_password=xxxxxx
#邮件标题
Email_title=运维告警
#默认发送邮箱
Default_emails=xxxxx@qq.com,xxxxx@qq.com

#---------------------↓七陌云接口-----------------------
#是否开启七陌短信告警通道,可同时开始多个通道0为关闭,1为开启
open-7moordx=0
#七陌账户ID
7MOOR_ACCOUNT_ID=Nxxx
#七陌账户APISecret
7MOOR_ACCOUNT_APISECRET=xxx
#七陌账户短信模板编号
7MOOR_DX_TEMPLATENUM=n
#注意:七陌短信变量这里只用一个var1,在代码里写死了。
#-----------
#是否开启七陌webcall语音通知告警通道,可同时开始多个通道0为关闭,1为开启
open-7moordh=0
#请在七陌平台添加虚拟服务号、文本节点
#七陌账户webcall的虚拟服务号
7MOOR_WEBCALL_SERVICENO=xxx
# 文本节点里被替换的变量,我配置的是text。如果被替换的变量不是text,请修改此配置
7MOOR_WEBCALL_VOICE_VAR=text

#---------------------↓telegram接口-----------------------
#是否开启telegram告警通道,可同时开始多个通道0为关闭,1为开启
open-tg=0
#tg机器人token
TG_TOKEN=xxxxx
#tg消息模式 个人消息或者频道消息 0为关闭(推送给个人),1为开启(推送给频道)
TG_MODE_CHAN=0
#tg用户ID
TG_USERID=xxxxx
#tg频道name
TG_CHANNAME=xxxxx
#tg api地址, 可以配置为代理地址
#TG_API_PROXY="https://api.telegram.org/bot%s/%s"

#---------------------↓workwechat接口-----------------------
#是否开启workwechat告警通道,可同时开始多个通道0为关闭,1为开启
open-workwechat=0
# 企业ID
WorkWechat_CropID=xxxxx
# 应用ID
WorkWechat_AgentID=xxxx
# 应用secret
WorkWechat_AgentSecret=xxxx
# 接受用户
WorkWechat_ToUser="zhangsan|lisi"
# 接受部门
WorkWechat_ToParty="ops|dev"
# 接受标签
WorkWechat_ToTag=""
# 消息类型, 暂时只支持markdown
# WorkWechat_Msgtype = "markdown"

#---------------------↓百度云接口-----------------------
#是否开启百度云短信告警通道,可同时开始多个通道0为关闭,1为开启
open-baidudx=0
#百度云短信接口AK(ACCESS_KEY_ID)
BDY_DX_AK=xxxxx
#百度云短信接口SK(SECRET_ACCESS_KEY)
BDY_DX_SK=xxxxx
#百度云短信ENDPOINT(ENDPOINT参数需要用指定区域的域名来进行定义,如服务所在区域为北京,则为)
BDY_DX_ENDPOINT=http://smsv3.bj.baidubce.com
#百度云短信模版ID,根据自己审核通过的模版来填写(模版支持一个参数code:如prometheus告警:{code})
BDY_DX_TEMPLATE_ID=xxxxx
#百度云短信签名ID,根据自己审核通过的签名来填写
TXY_DX_SIGNATURE_ID=xxxxx

#---------------------↓百度Hi(如流)-----------------------
#是否开启百度Hi(如流)告警通道,可同时开始多个通道0为关闭,1为开启
open-ruliu=0
#默认百度Hi(如流)机器人地址
BDRL_URL=https://api.im.baidu.com/api/msg/groupmsgsend?access_token=xxxxxxxxxxxxxx
#百度Hi(如流)群ID
BDRL_ID=123456
#---------------------↓bark接口-----------------------
#是否开启telegram告警通道,可同时开始多个通道0为关闭,1为开启
open-bark=0
#bark默认地址, 建议自行部署bark-server
BARK_URL=https://api.day.app
#bark key, 多个key使用分割
BARK_KEYS=xxxxx
# 复制, 推荐开启
BARK_COPY=1
# 历史记录保存,推荐开启
BARK_ARCHIVE=1
# 消息分组
BARK_GROUP=PrometheusAlert
容器启动
docker run -d -p 8080:8080 --name prometheusalert-center -v /opt/linux/conf/app.conf:/app/conf/app.conf --restart always feiyu563/prometheus-alert:latest
prometheus中启动这个alerting
[root@iZi5c01zlzty2isavfgor5Z alertmanager]# cat /usr/local/prometheus/prometheus.yml
# my global config
global:
  scrape_interval: 15s # Set the scrape interval to every 15 seconds. Default is every 1 minute.
  evaluation_interval: 15s # Evaluate rules every 15 seconds. The default is every 1 minute.

# Alertmanager configuration
alerting:
  alertmanagers:
    - static_configs:
        - targets:
          - 'localhost:9093'  # Alertmanager 的地址

# Load rules once and periodically evaluate them according to the global 'evaluation_interval'.
rule_files:
  - "/usr/local/prometheus/rule/node-rule.yaml" # 引用告警规则文件

# A scrape configuration containing exactly one endpoint to scrape:
# Here it's Prometheus itself.
scrape_configs:
  - job_name: "prometheus"
    static_configs:
      - targets: ["localhost:9090"]
  - job_name:
  "Client"
    static_configs:
      - targets:
        - "10.145.114.114:20001"

remote_write:
  - url: "http://10.145.114.114:8086/api/v1/prom/write?db=prometheus&u=prometheus&p=prometheus"

remote_read:
  - url: "http://10.145.114.114:8086/api/v1/prom/read?db=prometheus&u=prometheus&p=prometheus"
消息推送
推送地址和模板放里面
[root@iZi5c01zlzty2isavfgor5Z alertmanager]# cat alertmanager.yml
global:
  # 在没有报警的情况下声明为已解决的时间
  resolve_timeout: 5m

route:
  # 接收到告警后到自定义分组
  group_by: ["alertname"]
  # 分组创建后初始化等待时长
  group_wait: 10s
  # 告警信息发送之前的等待时长
  group_interval: 20s
  # 重复报警的间隔时长
  repeat_interval: 5m
  # 默认消息接收
  receiver: "dingtalk"
receivers:
  # 钉钉
  - name: 'dingtalk'
    webhook_configs:
        # prometheus-webhook-dingtalk服务的地址
      - url: http://10.145.114.107:8080/prometheusalert?type=dd&tpl=prometheus-ceshi11&ddurl=https://oapi.dingtalk.com/robot/send?access_token=c04672a861211fd2653c579a2fb62e02ed2503c0d4370a233d5ab0acb0c5f9d3
        send_resolved: true
磁盘报警规则
[root@iZi5c01zlzty2isavfgor5Z alertmanager]# cat /usr/local/prometheus/rule/node-rule.yaml
groups:
  - name: 内存告警
    rules:
      - alert: 内存使用率高
        expr: floor(100 * (1 - (node_memory_MemAvailable_bytes / node_memory_MemTotal_bytes))) > 90
        for: 1m
        labels:
          severity: critical
          threshold: "内存使用率超过90%"
        annotations:
          description: "**{{ $labels.instance }}** 内存使用率已持续1分钟超过 **90%**,请立即处理!当前值: **{{ $value }}%**"

  - name: CPU告警
    rules:
      - alert: CPU使用率高
        expr: floor(100 - (avg by(instance) (irate(node_cpu_seconds_total{mode="idle"}[1m])) * 100)) > 90
        for: 1m
        labels:
          severity: critical
          threshold: "CPU使用率超过90%"
        annotations:
          description: "**{{ $labels.instance }}** CPU使用率已持续1分钟超过 **90%**,请立即处理!当前值: **{{ $value }}%**"

  - name: 磁盘告警
    rules:
      - alert: 磁盘 / 使用率高
        expr: floor(100 * ((node_filesystem_size_bytes{mountpoint="/"} - node_filesystem_avail_bytes{mountpoint="/"}) / node_filesystem_size_bytes{mountpoint="/"})) > 90
        for: 10m
        labels:
          severity: critical
          threshold: "根目录磁盘使用率超过90%"
        annotations:
          description: "**{{ $labels.instance }}** 根目录磁盘使用率超过 **90%**,请及时处理!当前值: **{{ $value }}%**"
结果

模板测试
{{ $var := .externalURL }}{{ $status := .status }}{{ range $k, $v := .alerts }}
{{ if eq $status "resolved" }}
## [告警恢复-通知]({{$var}})
#### 监控指标: {{$v.labels.alertname}}
#### 告警级别: **<font color="#F56C6C">{{$v.labels.severity}}</font>**
#### 当前状态: **<font color="#67C23A">已恢复</font>**
#### 故障主机: {{$v.labels.instance}}
* ###### 告警阈值: {{ or $v.labels.threshold "无" }}
* ###### 开始时间: {{GetCSTtime $v.startsAt}}
* ###### 恢复时间: {{if ne $v.endsAt "0001-01-01T00:00:00Z"}}{{GetCSTtime $v.endsAt}}{{else}}暂未恢复{{end}}
#### 告警恢复: <font color="#67C23A">已恢复, {{ or $v.annotations.description "无详细描述" }}</font>
{{ else }}
## [监控告警-通知]({{$var}})
#### 监控指标: {{$v.labels.alertname}}
#### 告警级别: **<font color="#F56C6C">{{$v.labels.severity}}</font>**
#### 当前状态: **<font color="#F56C6C">需要处理</font>**
#### 故障主机: {{$v.labels.instance}}
* ###### 告警阈值: {{ or $v.labels.threshold "无" }}
* ###### 持续时间: {{$v.labels.for_time}}
* ###### 触发时间: {{GetCSTtime $v.startsAt}}
#### 告警触发: <font color="#F56C6C">{{ or $v.annotations.description "无详细描述" }}

</font>
{{ end }}
{{ end }}
根据模板生成的json文件
{
  "receiver": "dingtalk",
  "status": "firing",
  "alerts": [
    {
      "status": "firing",
      "labels": {
        "alertname": "磁盘 / 使用率高",
        "device": "/dev/vda1",
        "fstype": "ext4",
        "instance": "10.145.114.113:20001",
        "job": "share",
        "mountpoint": "/",
        "severity": "critical",
        "threshold": "根目录磁盘使用率超过90%"
      },
      "annotations": {
        "description": "**10.145.114.113:20001** 根目录磁盘使用率超过 **90%**,请及时处理!当前值: **100%**"
      },
      "startsAt": "2024-12-12T01:22:28.115Z",
      "endsAt": "0001-01-01T00:00:00Z",
      "generatorURL": "http://iZi5c01zlzty2isavfgor5Z:9090/graph?g0.expr=floor%28100+%2A+%28%28node_filesystem_size_bytes%7Bmountpoint%3D%22%2F%22%7D+-+node_filesystem_avail_bytes%7Bmountpoint%3D%22%2F%22%7D%29+%2F+node_filesystem_size_bytes%7Bmountpoint%3D%22%2F%22%7D%29%29+%3E+90&g0.tab=1",
      "fingerprint": "013f3e49373b7e28"
    }
  ],
  "groupLabels": {
    "alertname": "磁盘 / 使用率高"
  },
  "commonLabels": {
    "alertname": "磁盘 / 使用率高",
    "device": "/dev/vda1",
    "fstype": "ext4",
    "instance": "10.145.114.113:20001",
    "job": "share",
    "mountpoint": "/",
    "severity": "critical",
    "threshold": "根目录磁盘使用率超过90%"
  },
  "commonAnnotations": {
    "description": "**10.145.114.113:20001** 根目录磁盘使用率超过 **90%**,请及时处理!当前值: **100%**"
  },
  "externalURL": "http://iZi5c01zlzty2isavfgor5Z:9093",
  "version": "4",
  "groupKey": "{}:{alertname=\"磁盘 / 使用率高\"}",
  "truncatedAlerts": 0
}
安全认证策略
Prometheus Server的安全认证配置
1.1、准备认证文件
生成认证文件的方法有多种,如使用python、用htpasswd等,本文使用htpasswd生成
备注:本文使用的环境为上一篇部署的环境
CentOS系统上安装htpasswd工具&&生成认证文件:
yum -y install httpd-tools
 htpasswd -nbB -C 10 admin admin123
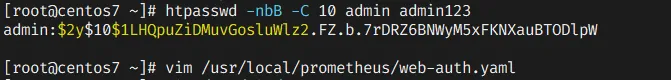
写入如下内容:

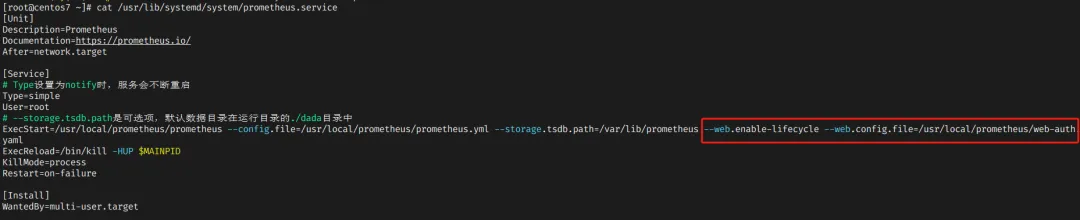
1.2、修改prometheus的service文件
vim /usr/lib/systemd/system/prometheus.service
在service文件里添加如下选项,为prometheus进程指定认证文件
--web.config.file=/usr/local/prometheus/web-auth.yaml
之后重新加载service文件,并重启prometheus进程
systemctl daemon-reload && systemctl restart prometheus

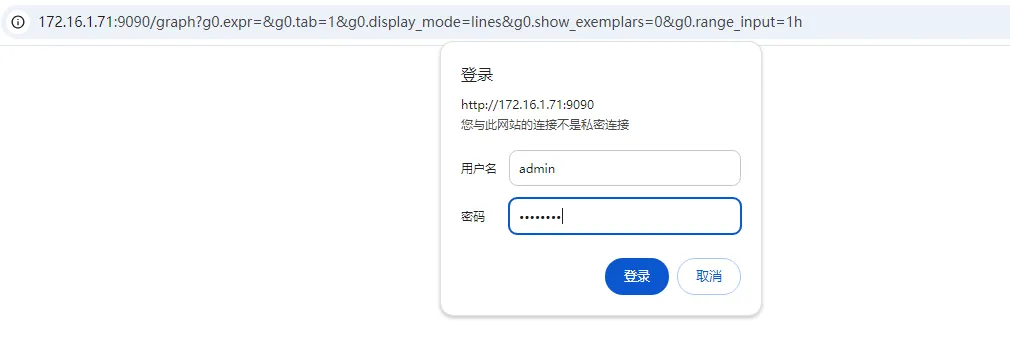
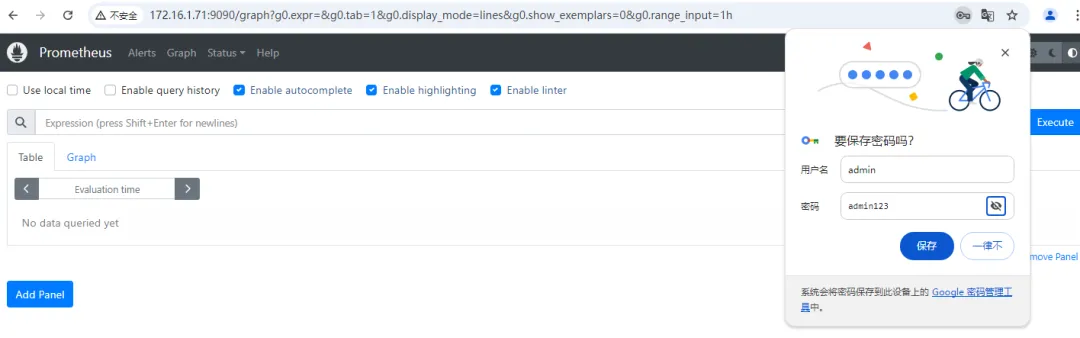
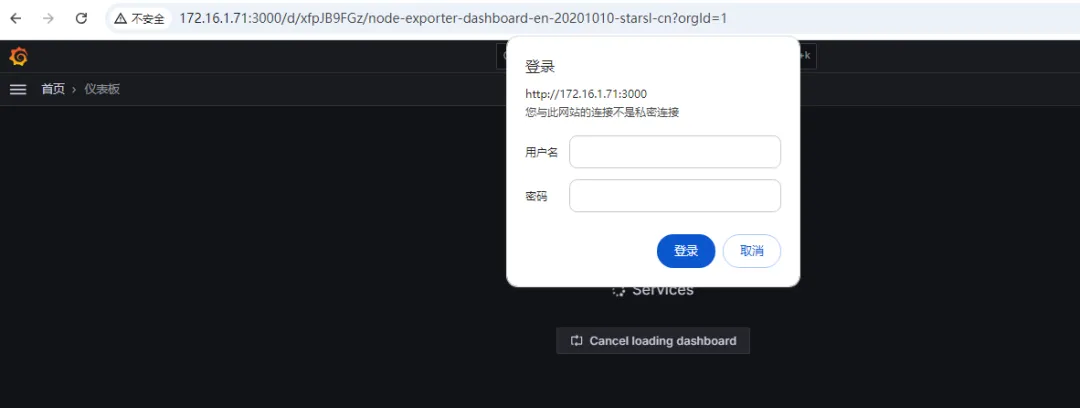
1.3、Web页面验证
通过以上已经完成了Prometheus Server的用户认证设置,现在通过Web访问Prometheus,需要用户名、密码认证:
1.4、Grafana访问认证
因为grafana需要读取Prometheus的数据,此时Grafana上也需要用户名、密码认证了:
这是需要在Grafana的数据源配置Prometheus的安全认证,如下,找到Prometheus的数据源,Authentication配置项中配置用户名密码
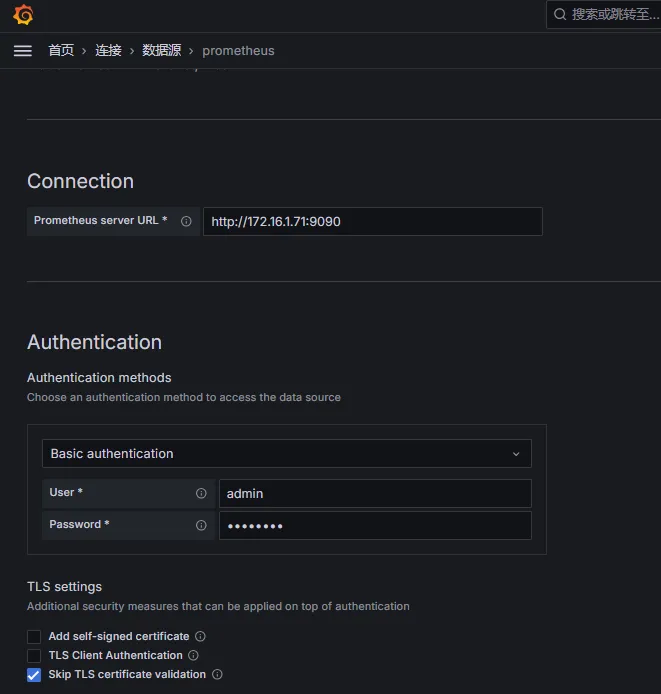
先跳过TLS证书验证,配置上Prometheus Server的用户名密码后,Grafana上的仪表板才能正常打开:
二、Node_exporter的安全认证Node_exporter的安全认证配置与Prometheus Server的安全认证过程类似
2.1、准备安全认证文件
使用的工具与Prometheus Server使用工具一样
htpasswd -nbB -C 10 k8s-master01 k8s-master01123
2.2、编辑认证文件
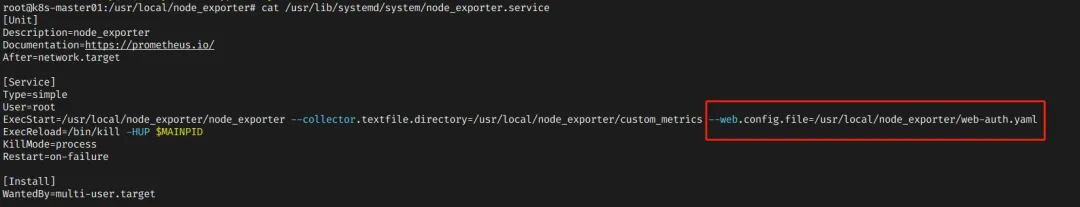
2.3、修改prometheus的service文件
在service文件里添加如下选项:
--web.config.file=/usr/local/prometheus/web-auth.yaml
2.4、重启node_exporter
systemctl daemon-reload && systemctl restart node_exporter
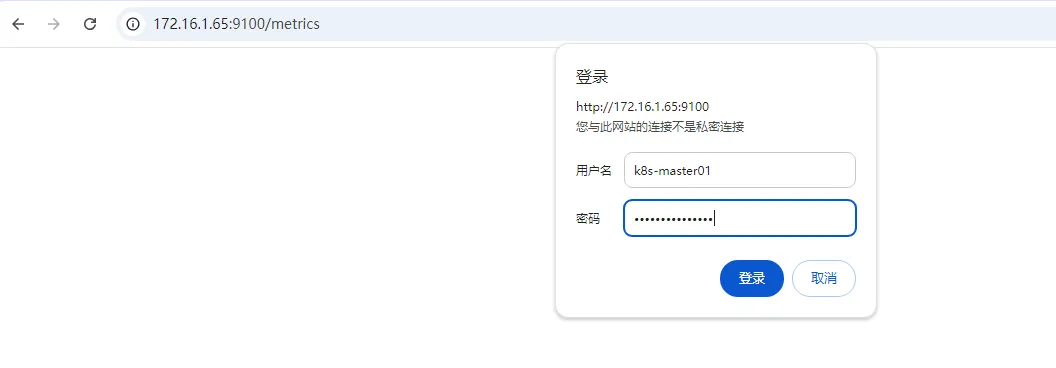
2.5、Web访问node_exporter
现在访问Node_exporter的web压面,需要填写用户名密码


评论区